Key Takeaways
- China’s GDP per capita increased more than 10x since 2000—the fastest among major economies.
- Russia and India also saw large gains, with GDP per capita rising 811% and 589%, respectively.
- Japan is the only country where GDP per capita declined over the past 25 years.
Over the last 25 years, economic output per person has grown at very different speeds across the world’s largest economies.
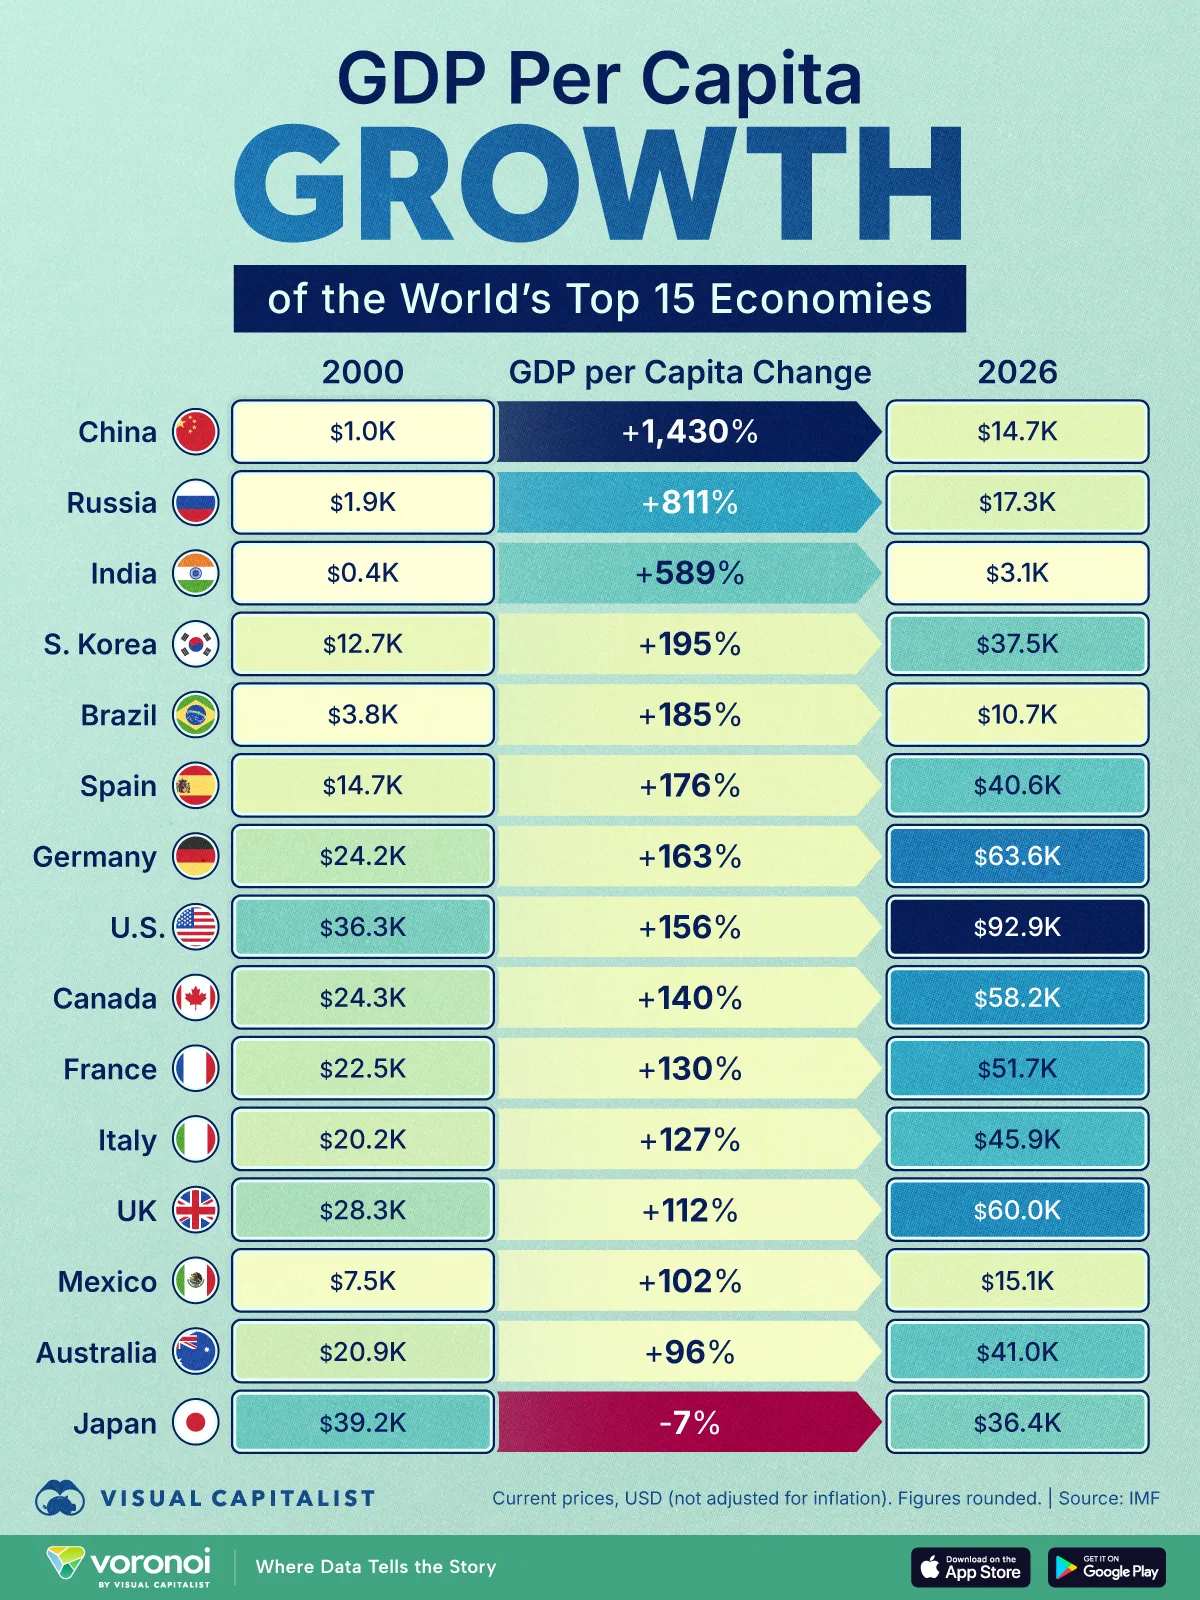
This chart ranks GDP per capita growth across 15 major economies from 2000 to 2026, based on data from the International Monetary Fund, highlighting where living standards have improved the most.
The data shows a clear divide: emerging markets like China and India recorded rapid gains in output per person, while advanced economies saw slower, more uneven growth, with Japan standing out as the only country where GDP per capita declined.
A Quarter Century of Uneven Growth
Among major economies, China leads by far, with GDP per capita rising from roughly $1.0K in 2000 to $14.7K in 2026, a 1,430% increase.
This means China added more output per person, in percentage terms, than any other major economy, fundamentally reshaping its position in the global middle class. India also recorded significant gains, with GDP per capita climbing from $0.4K to $3.1K, among the sharpest rises globally.
| Country | GDP Per Capita 2000 | GDP Per Capita 2026 | Change 2000-2026 |
|---|---|---|---|
| 🇨🇳 China | $1.0K | $14.7K | 1,430% |
| 🇷🇺 Russia | $1.9K | $17.3K | 811% |
| 🇮🇳 India | $0.4K | $3.1K | 589% |
| 🇰🇷 South Korea | $12.7K | $37.5K | 195% |
| 🇧🇷 Brazil | $3.8K | $10.7K | 185% |
| 🇪🇸 Spain | $14.7K | $40.6K | 176%
|
| 🇩🇪 Germany | $24.2K | $63.6K | 163% |
| 🇺🇸 U.S. | $36.3K | $92.9K | 156% |
| 🇨🇦 Canada | $24.3K | $58.2K | 140% |
| 🇫🇷 France | $22.5K | $51.7K | 130% |
| 🇮🇹 Italy | $20.2K | $45.9K | 127% |
| 🇬🇧 UK | $28.3K | $60.0K | 112% |
| 🇲🇽 Mexico | $7.5K | $15.1K | 102% |
| 🇦🇺 Australia | $20.9K | $41.0K | 96% |
| 🇯🇵 Japan | $39.2K | $36.4K | -7% |
Russia saw GDP per capita jump 811%, marking a robust economic turnaround following the country’s financial collapse in 1998.
Around 2000, Russia began ramping up oil production after decades of decline, driving its economic recovery. While state control of energy assets stood at around 10% in 2000, it grew to nearly 50% in less than a decade.
Meanwhile, South Korea’s GDP per capita more than tripled to reach $37.5K, owing to its manufacturing prowess. Since 2000, it has transformed from an emerging to an advanced economy, with GDP per capita now exceeding Japan’s.
Similarly, GDP per capita in Brazil grew notably, fueled by a commodity boom in the 2000s, although growth slowed in the decade that followed.
Advanced Economies See Slower Growth
While rich nations saw comparatively lower growth than developing markets, a wide gap emerged within this group.
Overall, Spain experienced the fastest growth, with GDP per capita rising 176%. In 2025, it grew at nearly twice the rate of eurozone countries, supported by domestic consumption and tourism.
Germany, meanwhile, saw GDP per capita increase 163%, even outpacing the U.S.’s gain of 156%. Yet unlike Spain, Germany has recently faced dismal growth amid weaker exports.
Japan stands alone as the only major economy where GDP per capita is lower today than in 2000. Compared to 2000, GDP per capita has contracted 7%, due to a mix of low inflation, slow population growth, and years of economic stagnation.
Learn More on the Voronoi App 
To learn more about this topic, check out this graphic on G7 vs. BRICS countries’ share of the global economy since 1980.
MY LATEST VIDEOS


Technology
Ranked: The Countries With the Most Data Centers
Dive into this visualization, which shows which countries have the most data centers globally – one place accounts for 43%.
Ranked: The Countries With the Most Data Centers
See visuals like this from many other data creators on our Voronoi app. Download it for free on iOS or Android and discover incredible data-driven charts from a variety of trusted sources.
Key Takeaways
- The U.S. hosts 43% of the world’s data centers, with 4,088 total.
- Germany and the UK are nearly tied for second place, separated by just one facility.
- Europe’s FLAP-D corridor remains a global hub for cloud and AI infrastructure.
The U.S. is home to 43% of the world’s data centers, by far the largest share globally.
As artificial intelligence scales, countries are racing to build the infrastructure needed to support it both now and in the future.
Because AI applications require low latency, data centers are increasingly being built closer to end users—fueling a global expansion in capacity.
This treemap graph visualizes which countries have the most data centers, using data from Data Center Map as of March 2026.
Which Country Has the Most Data Centers?
Most of the world’s data centers are in the U.S., at 4,088, which is more than eight times higher than the next country. AI penetration is greater in developed countries, so it also makes sense that data center locations skew this way.
Germany, which has the largest population in the European Union, is the second most data center-dense country at 507. The UK is close behind at 506.
Many data centers are clustered around the traditional FLAP-D corridor of Frankfurt, London, Amsterdam, Paris, and Dublin, which are close to metropolitan hubs and financial markets that need fast cloud and, increasingly, AI connections.
It makes sense, then, that France trails closely at 346, though China sits between it and the UK at 369 data centers.
Canada, India, and Australia—large countries with ample land to develop—are next in line, home to 270 data centers or more.
At the bottom of the dataset is Belarus, with two data centers, along with Monaco and Azerbaijan, which both have three.
The Future of Data Centers
As the world aggressively builds out its data center capacity, key questions remain around where infrastructure will go, given the finite nature of land and resources.
Some developers are investing in co-benefits for local communities to aid buy-in. In Ireland, for instance, which had a moratorium on data centers until late last year, an AWS data center feeds its excess heat into a district heating network for social housing and public buildings.
- Washington, D.C. had the highest unemployment rate in December 2025 at 6.7%, far above the 4.4% national average.
- Delaware saw the largest year-over-year increase, rising 1.6 percentage points from December 2024.
- California, New Jersey, Delaware, and Oregon ranked among the highest-unemployment labor markets at the end of 2025.
The U.S. unemployment rate stood at 4.4% in December 2025, but conditions varied sharply across states. Washington, D.C. stood out as a clear outlier, while several coastal labor markets continued to post elevated jobless rates.
This graphic ranks U.S. states by unemployment rate in December 2025 and shows the 12-month change from December 2024, based on data from the Bureau of Labor Statistics.
Three patterns stand out: D.C. at the top by a wide margin, Delaware recording the sharpest increase, and persistently higher unemployment across parts of the West Coast.
D.C. the Clear Outlier for Unemployment
Washington, D.C. had the highest unemployment rate in the country in December 2025 at 6.7%, up 1.4% from a year earlier and well above the national average.
The data below includes unemployment rates by state in December 2024 and December 2025.
D.C. had a challenging 2025, being impacted more than any anywhere else by the massive federal workforce reduction which saw over 300,000 government employees dismissed through either layoffs or voluntary resignation offers.
While not all of these workers were D.C.-based, the nation’s capital was at the center of reductions in force, as over 10% of the city’s population are employed by the federal government, compared to less than 3% nationally.
Highest and Lowest Unemployment in the U.S.
After D.C., the highest unemployment rates were in California (5.5%), New Jersey (5.4%), and Delaware and Oregon (both 5.2%).
When also considering Washington (4.7%), the West Coast average unemployment rate was over 5.1%, higher than any other region nationwide.
At the other end of the ranking, Hawaii and South Dakota (both 2.2%) had the lowest unemployment rates in the country, with Hawaii also seeing a 0.8% year-over-year drop.
Biggest Changes in Unemployment in 2025
Hawaii was not alone in seeing a notable decline in unemployment. Colorado and Kentucky each posted 0.8% drops over the course of 2025, while Indiana saw a slightly larger 0.9% reduction over the same period.
Delaware had the biggest increase in unemployment between December 2024 and December 2025 at 1.6%, followed by Maryland and Minnesota (both 1.1%).
These states saw the sharpest year-over-year changes in 2025, while California stood out for having one of the country’s highest unemployment rates with no change from a year earlier.